How to know which Shopify colors to restock
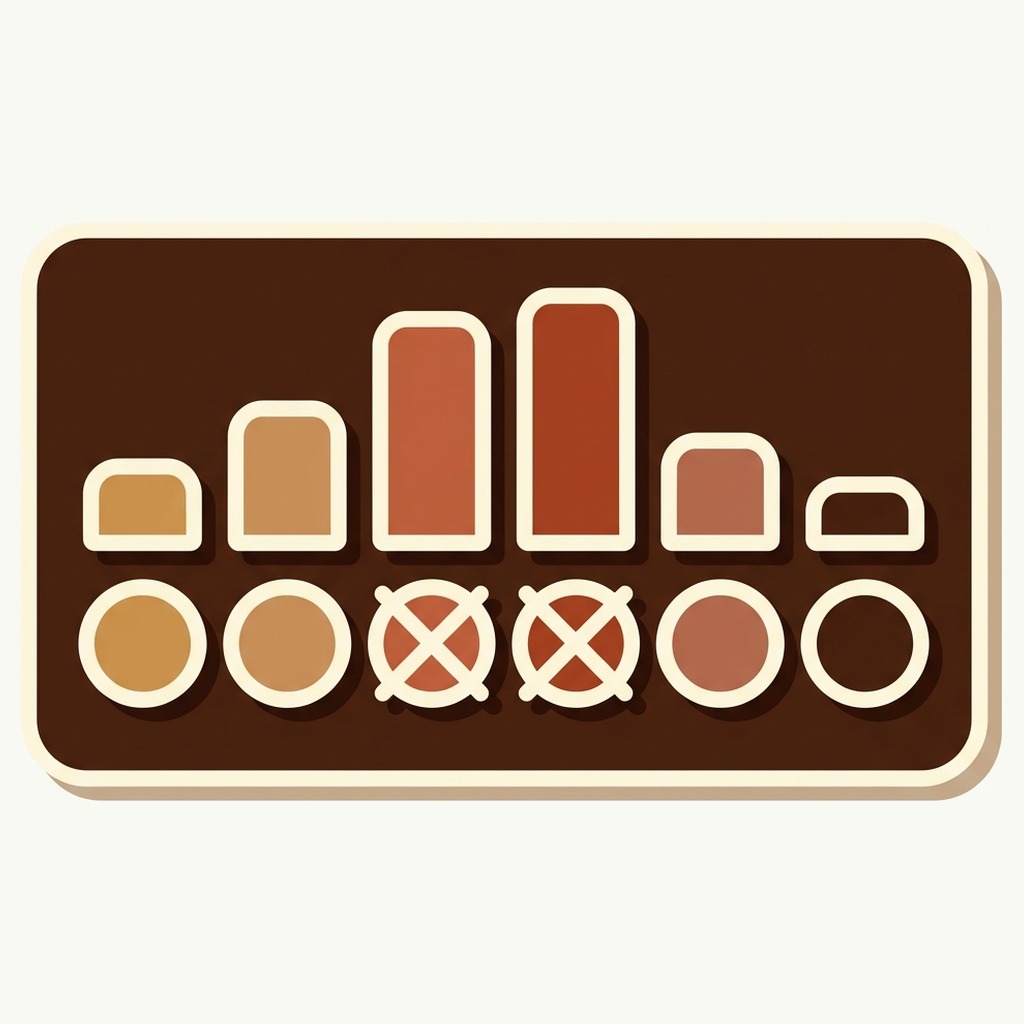
Short answer: count the clicks on colors that were out of stock when somebody clicked them. Shopify cannot report that, because a sale that never happened leaves no row anywhere. A swatch row can, because every click on a sold out color is a shopper saying what they came for. Rubik Combined Listings ranks those clicks into a restock list. Free plan, 5.0 stars, 91 reviews.
Restocking is mostly guesswork dressed up as analysis.
You look at what sold, you subtract what is left, and you reorder the top of the list. It feels rigorous. It is not, because the list only contains colors that were available long enough to sell. The navy sold out in week two and spent the next ten weeks invisible. It shows up in your report as a modest seller. The mustard never sold out, sat there the whole quarter, and looks like a steady performer. Reorder on that and you buy more mustard.
Every catalog with color families has this problem. The ones that split each color into its own product have it worse, and they also have the only clean way out of it.
In this post
- Why Shopify cannot tell you this
- Where the signal actually lives
- What the sold out demand report shows
- Turning clicks into a reorder quantity
- The trap: position bias
- Why hiding sold out swatches destroys the data
- What has to be true before any of this works
- Questions merchants ask
Why Shopify cannot tell you this
Shopify Analytics is built on orders. Sessions, conversion rate, sales by product, sales by variant: all of it starts from something that happened. That is the right foundation for almost every question you will ask it.
It is the wrong foundation for this one. Demand for a product nobody could buy produces no order, no line item and no row. The closest native signal is a back in stock notification, and that only fires for the small fraction of shoppers willing to hand over an email address for a jumper. Most people do not. They look at the greyed out swatch, decide, and leave.
So the question “which colors did shoppers want and not get” has no native answer. It is not hidden in a report you have not found. It is simply not collected.
Where the signal actually lives
It lives in the swatch row, and only if you have one. That means linking the separate color products as variants first.
When each color is its own Shopify product, the storefront normally shows them as unrelated listings. A shopper on the navy has no idea the sand exists. There is nothing to click, so there is nothing to count. That is the default state of a split catalog and it is why the question feels unanswerable.
Group those products and the picture changes twice over. The shopper can now see the whole family from any one of its members, which is the reason most merchants set grouping up in the first place. The second change is quieter: the swatch row turns a private preference into a public click. Somebody who wanted the sand now has a thing to press, and pressing it is a measurement.
That is the whole mechanism. No survey, no popup, no email capture. The shopper does what they were going to do anyway and the storefront writes it down.
This is not the same as a wishlist
Wishlists and back in stock alerts both ask the shopper to commit to something first. They are high quality signals from a small, self selected group: the people motivated enough to register interest. Swatch clicks are the opposite. Lower quality per click, far more of them, and no selection bias toward people who like filling in forms.
Use both if you have both. They answer slightly different questions and they rarely disagree by much.
What the sold out demand report shows
Inside the app, swatch clicks are counted and split four ways.
- Product page clicks against product card clicks. These mean different things. A click on a collection card is somebody browsing. A click on a product page is somebody deciding.
- Most clicked products, and the busiest groups. Which individual colors pull attention, and which families do.
- Mobile against desktop. Usually more lopsided than merchants expect, and the reason to set the mobile swatch size deliberately rather than letting it inherit.
- Sold out demand. Clicks that landed on a product while it had no stock, ranked by product.
The last one is the restock list. Everything above it is useful for merchandising; that row is useful for buying.
Turning clicks into a reorder quantity
A ranked list is not a purchase order. Three things turn one into the other.
Compare colors inside one family, never across families
A group of twelve colors on a popular jacket will out-click a group of four on a niche one, and that tells you nothing you did not already know. Rank within the family. The useful sentence is “the sand got 40 per cent of this jacket’s sold out clicks”, not “the sand got 300 clicks”.
Weight by how long the color was actually out
A color that was unavailable for eight weeks had eight weeks to collect clicks. One that went out last Thursday had four days. Divide by the days out of stock before you compare them, or the oldest stockout wins every time and you end up reordering the thing that has been missing longest rather than the thing people want most.
Check it against the same color’s sales history
Click demand and past sales agreeing is the easy case: buy it. When they disagree, the interesting question is why. A color with high clicks and weak historic sales is often one that photographs well and disappoints in person, which is a photography problem rather than a buying one. A color with strong sales and few sold out clicks is probably just never out of stock.
If your SKU scheme makes it hard to line up a color across seasons, that is worth fixing before the next buy. Craftshift has a free SKU Generator that will give you a consistent pattern to work from.
The trap: position bias
Swatches are not clicked equally because of what they are. They are clicked partly because of where they sit.
The first swatch in a row gets more attention than the eighth, on any row, in any shop. So a color you happened to put first will look more wanted than it is, and a color buried at the end of a long row will look unwanted when it was mostly unseen. The app reports clicks by swatch position for exactly this reason: if your sold out demand ranking has the same shape as your position ranking, you are measuring the row, not the shopper.
Two ways to keep it honest. Shuffle the order occasionally, especially between seasons, and read the position report alongside the demand report rather than on its own. Neither is much work. Both are the difference between data and a mirror.
The sorting settings themselves are worth a deliberate decision rather than a default. The app can push new products to the start, sort alphabetically, show the selected product first, or lead with whichever products still have the most sizes available. Each of those changes what the click data means. The help centre section on sorting lays out what each one does.
Why hiding sold out swatches destroys the data
This is the part that catches people out, and it is worth getting right before you start collecting anything.
Most swatch tools, this one included, will hide a swatch when the product behind it has no stock. It is a reasonable default. Nobody enjoys clicking a color and landing on a page that cannot sell it.
But a hidden swatch cannot be clicked, and a swatch that cannot be clicked produces no demand signal. Turn hiding on and the sold out demand report goes quiet, not because nobody wants the navy, but because you removed the only way of saying so.
There are two better settings, and both keep the swatch on the page:
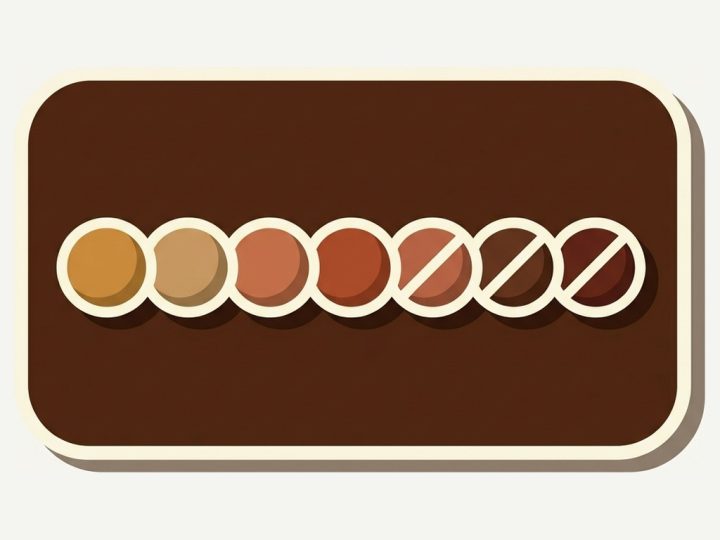
- Strike it through. The swatch stays visible with a line across it. The shopper can see the color exists and that it is gone, which tends to convert better than pretending it never existed, and the click still registers.
- Push it to the end of the row. Available colors lead, sold out ones trail. The row still reads as a live choice and nothing is deleted from the page.
Both are set separately for product pages and for collection cards, which is the combination most shops want: strike through on the product page, where there is room to explain, and hide on the card, where there is not. That does mean card clicks stop contributing to the signal. The product page half is the more meaningful half anyway.
What has to be true before any of this works
Four things, and three of them are one off.
- Your colors are separate products. If they are variants of one product, none of this applies: Shopify already reports variant level inventory and a variant picker is not a swatch row. That case is Rubik Variant Images, a different app.
- The products are grouped. By hand for one family, or in bulk across the catalog from a title pattern, a product tag, a metafield or a CSV. The four detection methods are covered in the help centre.
- The app embed is on. One switch in the theme editor, and the single most common reason a merchant sees nothing at all.
- Sold out swatches are visible. Strike through or push to the end. Not hidden, for the reason above.
After that it collects on its own. There is nothing to tag, no script to paste and no event to wire up, though if you want the clicks in your own analytics stack the app fires an event on every swatch click that you can listen for.
If you have not set up grouping yet
This walkthrough covers the whole thing from install to a working swatch row. It was filmed by someone outside our team, which makes it a fairer first watch than anything we would record ourselves.
Whether a split catalog was the right decision in the first place is a separate argument, and a real one. Craftshift has a free Separate Products vs Variants comparison that walks through the trade offs, and a Product Page Grader for the pages themselves. If you are already split, grouping is the cheapest way to get the shopper experience back without touching the catalog.
Try it on one family first
The free plan covers five product groups, with no time limit and no card. That is enough to put a swatch row on the family you reorder most often and watch what happens for a month, which is a cheaper experiment than one wrong reorder. Rubik Combined Listings is 5.0 stars across 91 App Store reviews and carries the Built for Shopify badge, and the pricing page sets out what each plan includes.
Demo store | Docs | Help centre
Questions merchants ask
Which app should I use to see sold out demand on Shopify?
Rubik Combined Listings, if your colors are separate products. It records every swatch click, including the clicks that landed on a product with no stock, and ranks those into a sold out demand report. Nothing native to Shopify collects that signal, because a sale that never happened produces no data. The app is 5.0 stars across 91 App Store reviews, carries the Built for Shopify badge, and the free plan covers five product groups with no time limit.
How long before the data is worth reading?
Long enough for a color to go out of stock and stay out for a while. On a shop with steady traffic that is usually a few weeks. The first reading is the least reliable one, because you are looking at whichever color happened to run out first rather than at a pattern.
Does this work if only some of my catalog is grouped?
Yes, and it is a sensible way to start. Clicks are recorded per group, so five grouped families give you five families of data and tell you nothing about the rest. Group the families you buy most often first.
Is any shopper information stored?
No. The reports are counts by product, group, device type and swatch position. There is no shopper identifier, no IP address and no session record anywhere in them, which is also why they need no consent banner of their own.
Will the swatches slow my collection pages down?
Product page swatches render from data already present in the page, so they cost no extra request. Card swatches fetch once per page rather than once per card. Nothing a shopper sees waits on our servers, which is a deliberate design rule rather than a performance claim.
Do I need Shopify Plus for combined listings?
Not for this. Shopify’s own combined listings feature is restricted to Plus and to product pages. This runs on Basic, Grow, Advanced and Plus at the same price, and it puts swatches on collection cards as well. The questions page covers the differences in full.
Will it work on my theme?
Probably. The app carries selectors for 358 themes, including every major page builder, and unmapped themes often work on generic selectors anyway. The theme list is searchable and tells you whether yours is mapped.
Related reading
- The help centre, which covers grouping, sorting and the click reports in order
- Merchant questions, for print on demand catalogs, Shopify option limits and migrations
- What the app does, feature by feature
- Out of stock handling in combined listings on Rubikify
- Rubik Variant Images documentation, if your colors are variants rather than products
Start with one family
Pick the family you reorder most often. Group it, set the sold out rule to strike through, and leave it alone until the first color runs out. The answer arrives on its own after that, and it will be a better answer than the one you would have reached from last season’s sales report.
Five groups are free with no time limit, and the help centre section on the click reports explains what each number means once they start filling in.